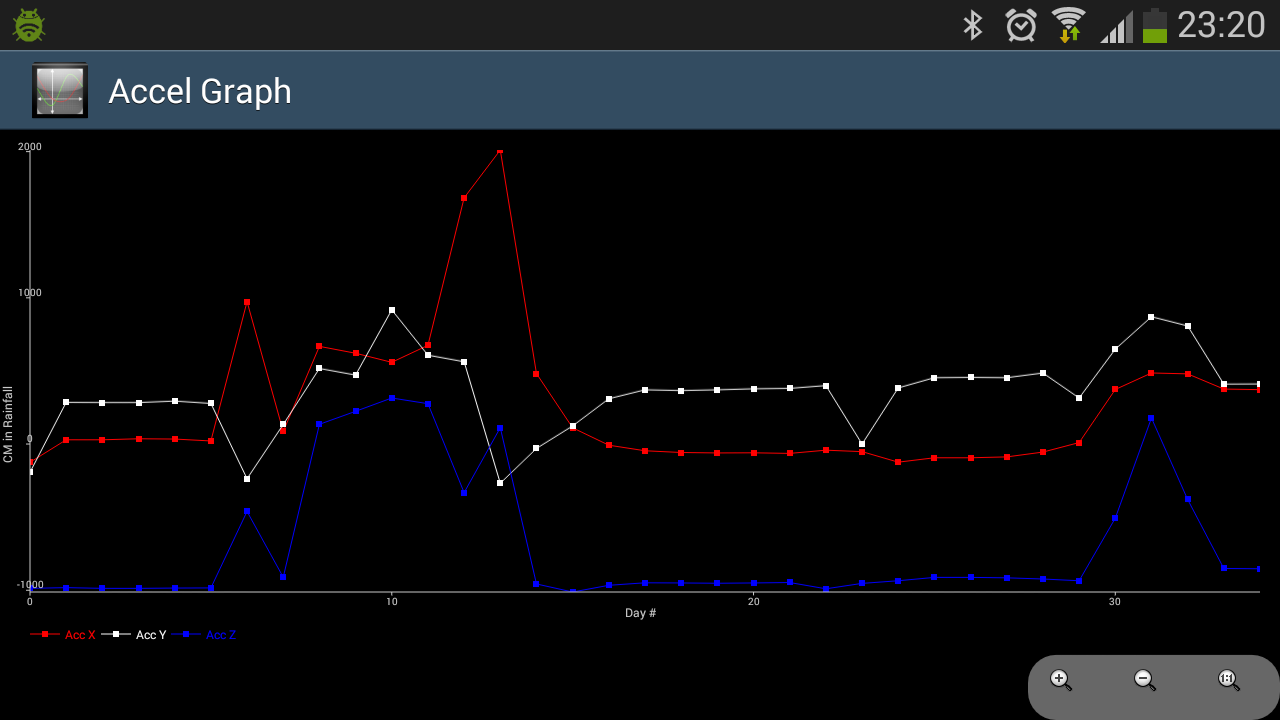
Real time graph visualisation of accelerometer data.  Runs at a sampling rate 25hz. The values displayed represent the mean value of each axis (X, Y, Z)r eceived per second.
The accelerometer data is transmitted to the phone using AppMessage protocol. The watch app displays the number messages sent to phone app/ received by phone app/ and failed to send to phone app.