 11
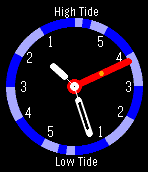
11Tide Watch (Australia)
FacesTide watch showing state of tide (Australia only) - hours to high & low tide and when shaken, up-coming & previous tide levels. It also shows the time! Use the Settings page to select the location to view & to permanently display tide levels. Note that viewing tide information for a location in a different timezone from where you are located will result in incorrect time to next tide being displayed. If you need another (Australian) location added, email & let me know. The tide levels work as follows. On the side of the clock where the tide hand is (The Rising/Falling indicator makes this clear close to the high/low times) the levels are the previous level & the next level. On the other side, are the levels of the following tide. The up-coming level & the start level of the next tide are (of course!) always the same. If you are showing Fort Dennison, the yellow dot on the tide hand indicates the magnitude of the tidal flow (difference between high/low). High flows have the dot near the outer end of the tide hand. This number (tidal coefficient) is not available from the BoM so is approximated The extra segments at the 6 hour mark remind you that some tides exceed 6 hours. The hand will only move below 6 hours. Note that this data must not be relied on for navigation purposes. In using this WatchApp, you are making use of tide predictions kindly provided by the Bureau of Meteorology. Please refer to & comply with the following page of copyright, disclaimers and usage information: http://www.bom.gov.au/oceanography/projects/ntc/nsw_tide_tables.shtml
 8
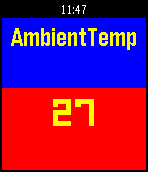
8BlueMix IoT Demo
Tools & UtilitiesSimple Pebble.JS (Javascript only) app to fetch data from IBM BlueMix. The data is provided from a TI SensorTag via the IoT Foundation to a Node Red application. As the app expects a simple response from a web site in the form of a JSON structure, it can potentially be used for any site that provides data in an appropriate form. The latest version of the app allows you to configure your own URL. Data consumed by the app from the BlueMix site at present looks like the following:- { "gyro_x": "-3.64", "ambient_temp": "24.03", "gyro_y": "-0.88", "gyro_z": "-0.75", "key_2": "0", "key_1": "0", "compass_x": "0.00", "object_temp": "27.38", "compass_y": "0.00", "compass_z": "0.00", "acc_z": "-0.95", "acc_y": "0.01", "acc_x": "-0.02", "air_pressure": "894.03", "reed_relay": "0", "light": "346.72" } ...exactly as provided by the SensorTag. The app is now configurable so the web site may be selected by you. Use the configure button on your phone to change the URL from which it fetches data. Default is my app which sees data from my SensorTag. Up/Down buttons cycle through the available data. Select refreshes. Data will only change when my SensorTag is on & connected to IBM BlueMix!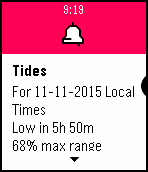 3
3Sydney Harbour Weather and Tide Browser
DailyIf you sail or race on Sydney harbour, you should find this app useful! It is a browser on your wrist that you can use to display weather data in a watch friendly format. You need to configure the app before use by going to the Settings screen & pressing the Default button Once configured, it can provide constantly updated measurements from 3 Sydney Harbour weather stations some 3 south of Sydney (so you can watch a southerly change approaching!). If you select bom.gov.au, updates are provided about every 10 minutes. Data is displayable from North Head, Sydney Harbour, Fort Denison, Syndey Airport, Wattamolla, Belambi & Pt Perpendicular. It will also display the current forecast if properly configured. Sydney Closed Waters is the default. Note that since some text is abbreviated to attempt to fit in available space on the Pebble, the source web site should be relied on for a current and accurate forecast. Scroll up & down the 7 stations using the UP & DOWN buttons. Display the latest forecast with a single short press on the centre SELECT button. Display the selected tide forecast with a double click on the centre SELECT button. Manually request fresh weather data with a long press on the centre SELECT button. The app will automatically request the current weather every 10 minutes - this function allows you to request an update on demand. Caution - if left active on a mobile data connection, it will use approximately 12MB per day. It does not retrieve data when the watchapp is not displayed. Data you access is for your personal use only.
 9
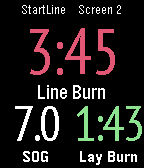
9StartLine for Pebble
Health & FitnessStartLine is an Android app to help you start and race better on the water. This is the Pebble Time display app to replicate data from this excellent free StartLine Android phone sailing app onto the Pebble screen. Screens can have 2, 3, 4 or 6 fields all of which can be configured as desired. There can be up to 10 different screens. As you move from starting to racing, the screen will automatically transition to one showing racing data. See the app website URL for full usage instructions. The Pebble Time version of the app replicates the colours used on the Android pre-start screens.